Like many of the phenomenon we encounter daily, we can measure and analyze vibration to study its effects.
We can analyze vibration frequencies to determine solutions to minimize their impact on people, places, and manufacturing. The tools and software of today are so advanced that we generate accurate vibration analysis reports to give us a quantifiable image of the events.
Below, we’ll show you:
- What a Fabreeka vibration analysis report looks like
- How to read a vibration analysis report
- Where vibration analysis is applied in the real world
These surveys are critical to the assessment, as they provide a visual aid to identify any issues. If you are working to find a solution to vibration yourself, jump to this section to view our vibration isolation and shock solutions.
What Is A Vibration Analysis Report?
A vibration analysis report is a document that provides detailed information about vibration frequencies and forces resulting from a piece of equipment in a manufacturing environment. The report includes information that is important for determining the current operating conditions of equipment, and to develop a recommendation for vibration isolation. In these documents you may find.png?width=200&height=260&name=Vibration%20Survey%20Screenshot%20Edited%20(2).png) :
:
- Information about the manufacturer, model, and size of the machine
- Vibration criteria for the equipment
- Operation speed of the machine in use
- The different vibration and frequency forces measured
Often, data collected from vibration surveys are presented as graphs and other quantifiable illustrations.
Also included in these reports is documentation of the tests performed, the type of sensors used, and a detailed outline of the vibration analysis process.
Once the results are collected and analyzed, engineers can then make an analysis based on their findings in the report. 👇
How To Read A Fabreeka Analysis Report
Now that we’ve covered the basic elements of a vibration analysis report, how are you supposed to read it? To the untrained eye, vibration surveys present a series of analyses, graphs, and figures that seem overwhelming, and confusing. Here’s a quick guide on reading and interpreting a Fabreeka vibration analysis report:
1. Review The Summary.png?width=200&height=258&name=Exec%20Summary%20(1).png)
The executive summary provides an important overview of what you can expect from the report before you jump into more detail.
This section typically includes information relevant to key findings, issues, and recommendations to address any vibration problems.
Additionally, the summary introduces important notes on how to interpret the findings throughout the report.
2. Analyze Graphs and Data
Here’s where things can get a little shaky. Graphs and data are utilized to graphically convey results of analysis and to support recommendations to reduce vibrations.
In a Fabreeka vibration analysis report, you’ll find data representing:
- Fast Fourier Transform spectral analysis (FFT)
- Displacement data
- Velocity and acceleration data
- Power Spectral Density
- Coherence
- Transient analyses
Here’s what some of those look like in pictures: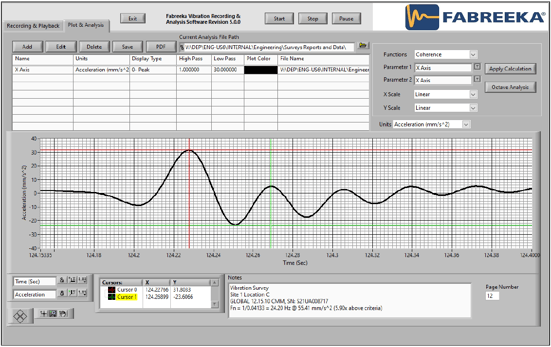
This graph is just one of many like it you'll see in the vibration analysis report. Plotted above is the acceleration of a vibration force over time. More specifically, this raw data focuses on a spike during the vibration readings, a point where the amplitude of the vibration is greater than at other points. When our engineers conduct vibration surveys, they take measurements from several different locations and directions.
In the image above, the vibration forces are measured relative to the position of the CMM along one of the three axes we measure for. Combining this raw data, the vibration measurements come together to form as close to a "3D" look at vibration forces.
YOU MIGHT LIKE: ["Pneumatic Vibration Isolation for External Vibration"]
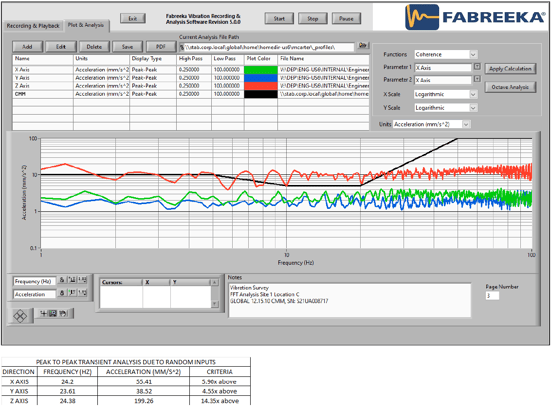
Above, Fabreeka engineers generated a Fast Fourier Transform spectral analysis (FFT), another important visual in the vibration analysis report. The FFT analysis combines vibration readings along different axes into an algorithm for an understanding of how the forces affect the CMM in different directions. The red, green, and blue lines all represent the way in which forces reverberate in three dimensions to give us an accurate representation of the phenomenon as possible.
Moreover, the black line represents the vibration criteria of the machine, which essentially shows how much vibration is allowable for the CMM to function accurately. In our example, the vibration along the "Z axis" far exceeds the vibration criteria, meaning that a vibration isolation solution would be required to reduce it. With all of this important data, Fabreeka’s engineers develop a complete understanding to recommend the best course of action.
3. Review The Final Analysis
Included in every vibration analysis report is a summary of the main points and purposes of the vibration study. If you suspect vibration may be causing noise, damage, or other disturbances, the final analysis identifies the problem at hand and highlights a solution for it. The next step is critical. All of this data is then formulated into a proper vibration isolation solution.
What's Next?Developing a vibration and shock control solution takes engineering prowess and high-quality materials. After conducting a vibration survey, the Fabreeka team considers our wide range of solutions to develop a vibration isolation system that reduces disturbing frequencies into the environment.
Vibration Isolation and Shock Control Solutions
Low frequency vibrations can adversely affect the accuracy, repeatability and throughput quality of your machinery and tools. Precision machining, manufacturing and inspection processes often take place simultaneously in disruptive environments. Fabreeka’s engineers quantify and analyze vibration and shock criteria to develop a solution that assures long term accuracy and reliability.
READ NEXT: ["Why Low Frequency Isolation is Important for the Aerospace Industry"]
On-Site Vibration Surveys
Fabreeka’s vibration experts conduct on-site surveys to collect and analyze the data for the vibration analysis report. Using highly sensitive equipment, we can measure vibration at very low frequencies. Fabreeka is often requested to perform measurements which require special data analysis, including:
- Tip and tilt phenomena
- Foundation/isolation system natural frequencies
- Long-duration time studies and other specialized analyses
We welcome, in fact, encourage requests for unique measurement requirements.
Our talented and dedicated team works with you to develop the best vibration control solution for your unique application. Don't hesitate to reach out, our team is ready to take on your next project!

SUBMIT YOUR COMMENT